Immerse yourself in the exciting world of stock market trading by betting on the virtual financial markets in this exciting live game from Evolution.
Predict if the stock value will go up or down, and if you guess correctly, you’ll profit based on the percentage increase or decrease.
How to play Stock Market Live
The betting page is very straightforward: there are two buttons that you can use to predict whether the next session will see the value of the stock market increase (‘Up’) or decrease (‘Down’).
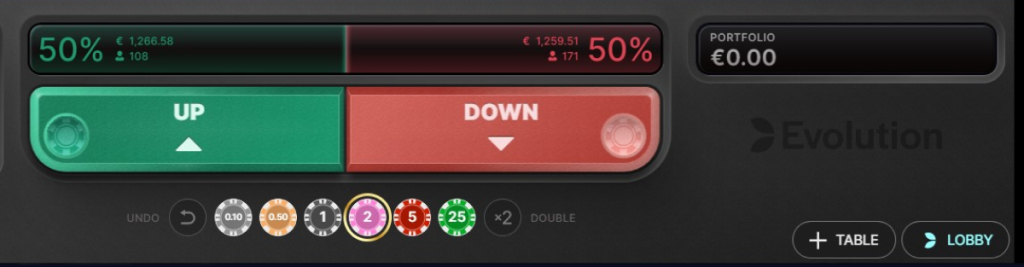
Underneath those buttons, there are some preset chip values to help you place bets. Simply click on a bet value, select ‘Up’ or ‘Down’, and wait for the market to move.
Watching your bet value rise or fall
Once betting has closed and the next trading session has begun, the value of the market is depicted by a line moving from left to right. If the line is green, the market value is above the opening level, whereas a red line means the market has lost value.
The percentage change is shown above that line as it moves across the trading area.
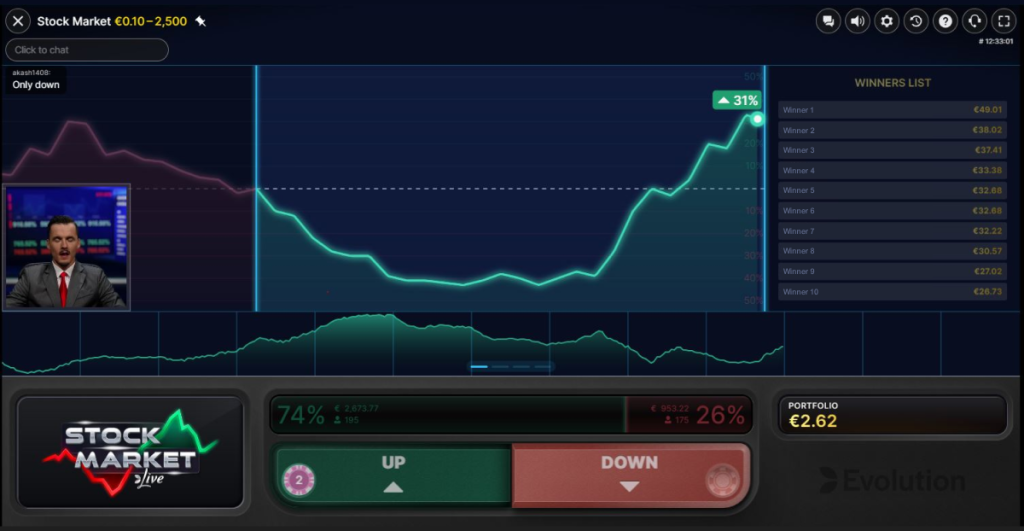
Above the ‘Up’ and ‘Down’ buttons, you can see how the other bettors think the market will change. This shows the percentage of money placed and the number of bettors who have wagered on each option.
To the right of those figures is a box titled ‘Portfolio’. This will show your initial bet, which will then update as the amount changes, depending on whether the stock market value increases or decreases.
How much can the markets rise or fall by?
In any session, the market can rise or fall by a maximum of 100%, but it can never end on 0%.
How are players’ wins and losses calculated?
The final returns will depend on the stock market’s percentage change in the session. For example:
- If you bet on ‘Up’ and the stock value goes up by 50%, you’ll win 50% of your bet (i.e., if you bet €10.00, your final balance will be €15.00).
- If you bet on ‘Up’ and the stock value goes down by 50%, your Portfolio loses that amount (i.e., if you bet €10.00, your final balance will be €5.00).
- If you bet on ‘Down’ and the stock value goes down by 75%, you’ll win 75% of your bet (i.e., if you bet €10.00, your final balance will be €17.50).
- If you bet on ‘Down’ and the stock value goes up by 75%, your Portfolio loses that amount (i.e., if you bet €10.00, your final balance will be €2.50).
Once the trading session has ended, the value shown in your ‘Portfolio’ box will be your final balance, which will then be automatically returned to your account balance (minus a 1% commission charge).
The final value will always be rounded up or down to the nearest smallest unit of currency.
Result statistics
There are four different ways in which the previous game results are presented to you. However, bear in mind that Stock Market Live is a RNG (random number generator) game, so past results are not indicative of what may happen in future rounds.
To see the different views, click on them on the main betting page and they will alternate through the various options. All the results are shown from left to right, with the most recent session on the right.
Linear charts
There are two linear charts, one showing the last 10 sessions, and the other showing the previous 50 sessions.
The colour of the chart (green or red) will depend on the overall rise or fall in value from the first session shown to the last.


Percentages

This shows the final percentage at the end of each session, with a green or red arrow to indicate a gain or loss respectively.
Candlesticks

Here, each round is depicted as a candlestick (or bar). The colour shows whether the value went up or down during the round, and the height of the candlestick depicts by how much.
Stock Market Live is a fast-paced game. For each betting round, you have 10 seconds to place your bets, then the round itself takes a further 10 seconds.
Try your luck on the Stock Market in the Marathonbet Live Casino, and you could be building up your portfolio!
You’ll find other reviews of exciting Live Casino games in the Marathonbet blog, including Lightning Dragon Tiger Live and Funky Time.